
The probability of a very strong El Niño during October–December rose from 81% in CPC’s July assessment to 95% in August. It stands at 90% for November–January and 70% for December–February.
NOAA’s August RONI forecast places the median October–December value at +2.66°C (+4.8°F), with the middle 50% of the forecast ranging from +2.37°C to +2.95°C (+4.3°F to +5.3°F).
The median falls to +2.23°C (+4°F) for December–February, keeping the central forecast in the very strong range during meteorological winter. A broad spread among the ensemble members shows that less extreme outcomes remain possible.
NOAA cautioned that even a very strong event would not produce the expected effects everywhere. Greater El Niño strength can increase the likelihood of established seasonal patterns, but it does not determine individual storms, cold waves or periods of heavy rainfall.
Pacific warming continues to accelerate
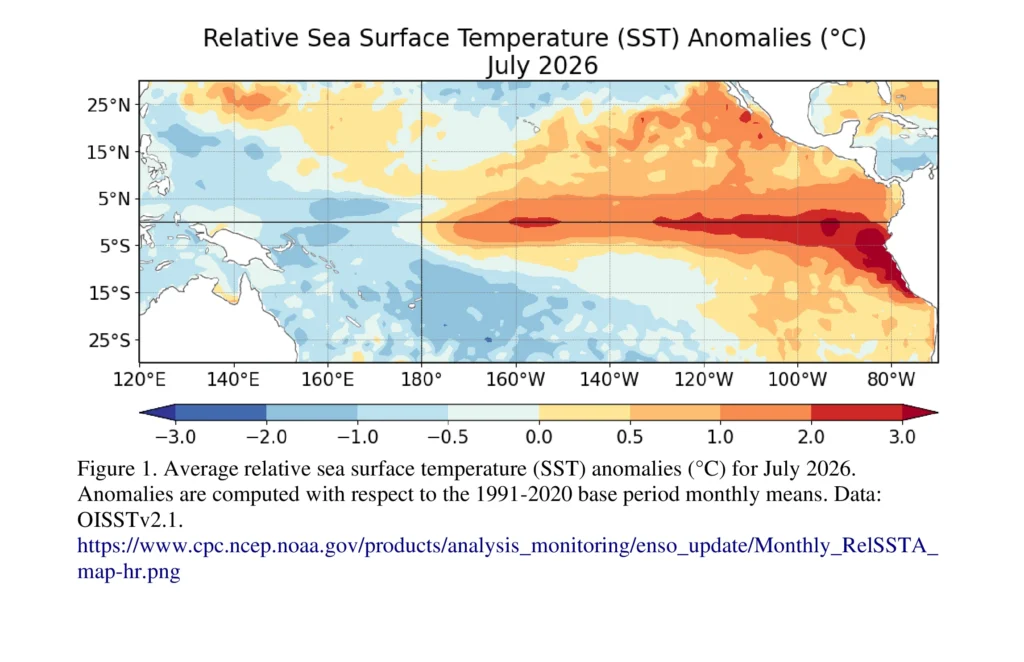
Conditions strengthened across the tropical Pacific during July. CPC reported sea-surface temperature anomalies of +1.4°C (+2.5°F) in Niño-3.4, +1.7°C (+3.1°F) in Niño-3 and +2.9°C (+5.2°F) in Niño-1+2.
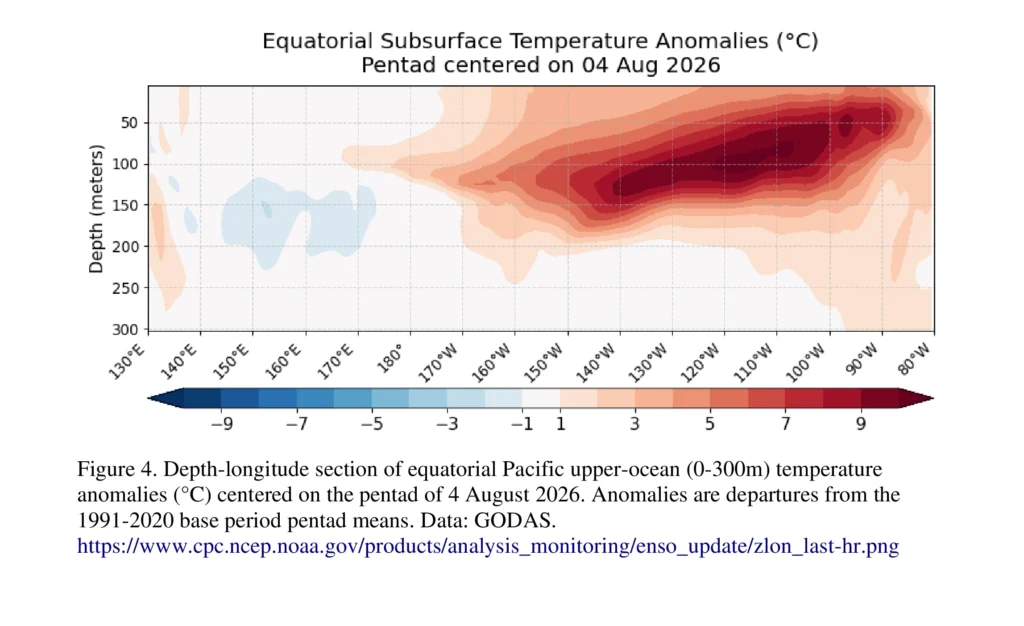
Warm subsurface water extended across the central and eastern equatorial Pacific, with localized anomalies reaching +10.0°C (+18.0°F).
Low-level westerly wind anomalies stretched from the western into the east-central equatorial Pacific, while upper-level easterly anomalies covered the same broad area. Convection increased over the central and eastern Pacific and remained suppressed over Indonesia.
Together, these oceanic and atmospheric changes indicate that the coupled El Niño system is strengthening.
The westerly wind anomalies weaken the normal easterly trade winds and help carry warm upper-ocean water eastward. Downwelling equatorial Kelvin waves deepen the thermocline, allowing subsurface warmth to spread toward the central and eastern Pacific.
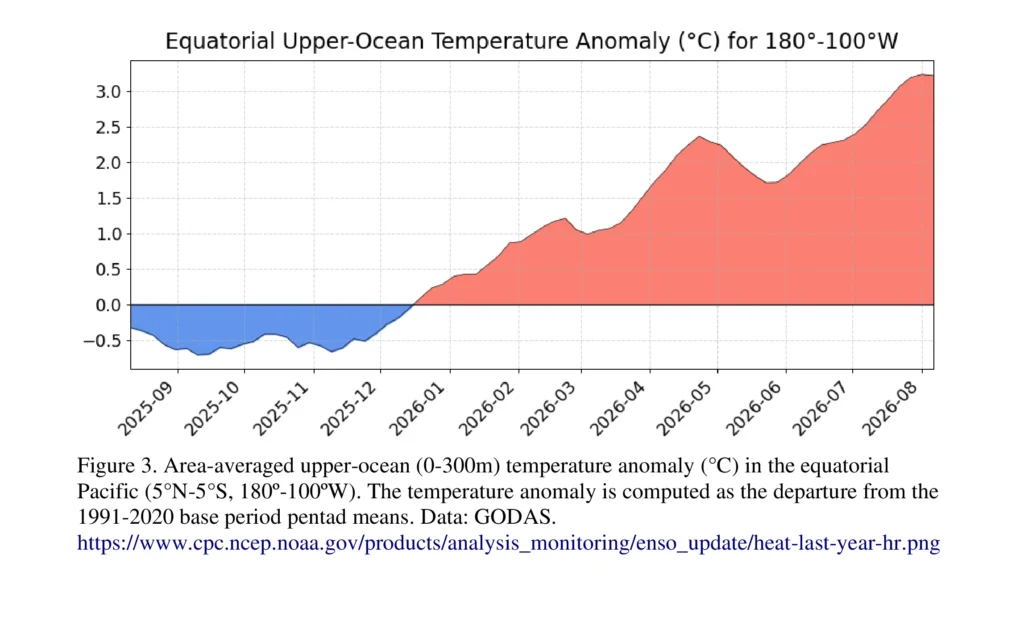
CPC identified downwelling Kelvin waves that began in December 2025 and in January, March, and June 2026. Positive subsurface temperature anomalies have recently increased again across the central and east-central Pacific.
Other national climate centers are reporting similarly strong indicators, although their measurements are not directly interchangeable.
Australia’s Bureau of Meteorology (BoM) recorded a relative Niño3.4 value of +2.20°C (+4°F) for the week ending August 9. It also reported that the July equatorial upper-ocean heat anomaly was the highest for any month in its record beginning in 1979.
The July Southern Oscillation Index fell to −29.1, the most negative July value in the BoM record.
The Japan Meteorological Agency (JMA) measured a July NINO.3 anomaly of +2.5°C (+4.5°F), tying July 1997 as the highest July value in its record beginning in 1949. Trade winds were much weaker than normal across the central equatorial Pacific, while convection was much stronger near the equatorial Date Line.
NOAA’s RONI, BoM’s relative Niño3.4 index and JMA’s NINO.3 index cover different regions or use different calculations and adjustments. Their values should not be compared as if they represented the same measurement.
U.S. outlook becomes more El Niño-like
CPC’s U.S. seasonal outlook was issued on July 16, before NOAA raised its El Niño strength probabilities in August. The regional temperature and precipitation probabilities therefore do not yet incorporate the latest assessment.
For December 2026–February 2027, the outlook favors above-normal temperatures across much of the West, the northern tier and parts of the East.
Signals are weaker across parts of the Southwest, southern Plains, Lower Mississippi Valley and Southeast, where CPC shows equal chances of below-, near- or above-normal seasonal temperatures in some areas.
Periods of below-normal temperature could still affect the southern tier even if the full three-month average does not finish below normal. Colder El Niño-related periods can compete with the longer-term tendency toward warmer seasonal averages.
The precipitation outlook carries a clearer El Niño signal. Below-normal precipitation is favored from the Northwest into the north-central United States, with the signal extending toward the Great Lakes in later forecast periods.
Above-normal precipitation is favored across much of the southern tier, with the highest winter probabilities over parts of the Southeast.
These relationships generally become more pronounced during fall and winter, when El Niño’s connection to North American climate is strongest.
CPC is scheduled to release its next U.S. seasonal outlooks on August 20. It will be the first long-lead package issued since the October–December probability of a very strong event rose from 81% to 95%.
CPC develops its outlooks from several sources, including the North American Multi-Model Ensemble, Climate Forecast System version 2, Copernicus Climate Change Service (C3S) guidance, statistical tools, climate trends and historical ENSO relationships.
ECMWF operates a 51-member seasonal ensemble, while the Copernicus Climate Change Service combines several prediction systems into a multi-model forecast. These systems show broad shifts in seasonal probabilities, not the timing of specific weather events.
Detailed regional descriptions of the August ECMWF forecast below come from Severe Weather Europe’s interpretation of the model output. The underlying regional charts were not independently verified for this report.
For December–February, the outlet identifies a deep low-pressure anomaly near the Aleutian region and higher pressure across Canada. Its interpretation favors above-normal temperatures across Canada, the northern United States, the West Coast and parts of the Northeast, with cooler anomalies across Texas, the Gulf Coast and Southeast.
The same analysis shows lower seasonal snowfall across parts of the northern United States and southern Canada and higher totals across parts of the central and eastern United States and southeastern Canada.
Snowfall has lower seasonal predictability than broad temperature or precipitation patterns. Even where a wetter pattern provides more moisture, snowfall depends on sufficiently cold air and a favorable storm track arriving at the same time.
Warmer-than-normal conditions across much of the country, with lower snowfall are expected across parts of southern Canada and higher snowfall toward southeastern Canada.
Official Canadian seasonal guidance is issued by Environment and Climate Change Canada using the Canadian Seasonal to Interannual Prediction System. Detailed CanSIPS probabilities for winter 2026–27 were not extracted for this article, so the regional Canadian discussion above should not be read as an official ECCC outlook.
Europe has a weaker and less direct relationship with tropical Pacific ENSO than North America.
The UK Met Office notes that El Niño can raise the likelihood of a windy, mild start to a UK winter and a colder end. This is a broad historical relationship rather than a specific forecast for winter 2026–27.
The North Atlantic Oscillation, Indian Ocean Dipole, jet-stream position and stratospheric conditions can all modify the European response.
The August 10 C3S update focuses mainly on autumn rather than winter. It shows wetter-than-average signals across southern and western Europe, but forecast uncertainty is higher and seasonal skill is lower over Europe than in tropical regions.
C3S also reported that global precipitation patterns remained consistent with El Niño. Agreement among its component models has increased on the development of a positive Indian Ocean Dipole during the coming months.
For December–February, Severe Weather Europe interprets the ECMWF forecast as showing lower pressure toward northern and northwestern Europe and stronger westerly Atlantic flow into the continent.
That pattern favors above-normal seasonal temperatures across large parts of Europe. The same analysis shows lower snowfall across many lower-elevation areas, while northern, northeastern and mountainous regions retain higher snowfall potential.
The forecast remains sensitive to the North Atlantic Oscillation and the position of the jet stream, both of which strongly influence winter conditions across the UK and nearby Europe.
Strength alone does not determine winter impacts
Very strong El Niño events do not always behave like amplified versions of moderate events.
Beniche et al. (2024) analyzed observations and large atmospheric-model ensembles and identified an eastward shift in the North American teleconnection during the extreme El Niño winters of 1982–83, 1997–98 and 2015–16.
During those events, strong eastern-Pacific warming allowed deep tropical convection to extend farther east. The resulting shift in tropical atmospheric heating moved the associated North American response eastward.
In the study’s simulations, precipitation anomalies exceeded 0.5 standard deviations across the western United States in 74% of the sampled extreme-El-Niño cases. Temperature anomalies exceeded the same threshold across Canada and the northern United States in 71% of the cases.
Those percentages apply only to the simulations examined in the study and should not be read as probabilities for winter 2026–27.
The 2023–24 El Niño offers a different example. Zhang et al. (2025) ranked it as the fourth strongest event since 1979 but found that it produced an unusually weak Pacific–North American teleconnection.
Tropical Pacific rainfall anomalies averaged about 0.75 mm/day (0.03 inches/day), approximately one-third of the response during the three strongest events examined by the researchers despite very warm Pacific surface waters.
Atmospheric-model experiments found that exceptional warming in the tropical Indian and Atlantic Oceans counteracted part of the Pacific forcing. The extra-Pacific warmth altered tropical rainfall and substantially weakened the atmospheric response over the North Pacific.
For the developing 2026 event, the location and intensity of deep tropical convection will therefore be as important as the headline Niño3.4 or RONI values in determining the winter circulation response.
The Indian Ocean is already showing signs of change. BoM reported an Indian Ocean Dipole index of +0.41°C (+0.7°F) for the week ending August 9, marking a third consecutive week at or above its +0.4°C (+0.7°F) positive threshold.
BoM continued to classify the Indian Ocean Dipole as neutral on August 11 because the threshold must persist before an event is considered established. Its models favor a positive event, while C3S reported increased agreement among its component systems compared with earlier forecast runs.
References:
1 ENSO Diagnostic Discussion – NOAA/CPC – August 13, 2026
2 Official NOAA Relative Oceanic Niño Index (RONI) Outlook – NOAA/CPC – July 16, 2026
3 Prognostic Discussion for Long-Lead Seasonal Outlooks – NOAA/CPC – July 16, 2026
4 Southern hemisphere monitoring – BOM – August 11, 2026
5 Super El Niño Keeps Growing as New Forecasts Reach Record Territory Ahead of Winter – SWE – August 12, 2026
6 A distinct and reproducible teleconnection pattern over North America during extreme El Niño events – Beniche et al., Scientific Reports – January 30, 2024
7 The 2023/24 El Niño event exhibited unusually weak extratropical teleconnections – Zhang et al., Communications Earth & Environment – July 28, 2025